到这一章,我们的框架核心功能的原理和实现就已经介绍完了。那拥有这些能力的框架究竟性能如何呢,我们在这一章节就来测试一下。
一、编写性能测试工具
为了测试框架性能,我们需要写一个测试工具,这个工具能够模拟不同的并发数和 qps 请求,实现对我们 gorpc 框架开发的 server 的不断发包和收包。
这个工具的代码都放在 github 上了,地址为:gorpc-benchmark
下面简单介绍下这个工具的实现:
先定义了一个 Counter 类来汇总一些核心数据,包括总请求量、请求的成功量、失败量、并发数、总耗时等。
type Counter struct {
   Succ        int64 // 成功量
   Fail        int64 // 失败量
   Total       int64 // 总量
   Concurrency int64 // 并发量
   Cost        int64 // 总耗时 ms
}
接下来需要实现根据指定的并发数、总请求数来进行发包,这里的发包我们还是使用 gorpc 框架自带的 client。
func request(totalReqs int64, concurrency int64, target string) {

   perClientReqs := totalReqs / concurrency

   counter := &Counter{
      Total:       perClientReqs * concurrency,
      Concurrency: concurrency,
   }

   opts := []client.Option{
      client.WithTarget(target),
      client.WithNetwork("tcp"),
      client.WithTimeout(2000 * time.Millisecond),
      client.WithSerializationType("msgpack"),
   }
   c := client.DefaultClient
   req := &testdata.HelloRequest{
      Msg: "hello",
   }

   var wg sync.WaitGroup
   wg.Add(int(concurrency))

   startTime := time.Now().UnixNano()

   for i := int64(0); i < counter.Concurrency; i++ {

      go func(i int64) {
         for j := int64(0); j < perClientReqs; j++ {

            rsp := &testdata.HelloReply{}
            err := c.Call(context.Background(), "/helloworld.Greeter/SayHello", req, rsp, opts...)

            if err == nil && rsp.Msg == "world" {
               atomic.AddInt64(&counter.Succ, 1)
            } else {
               log.Info("rsp fail : %v", err)
               atomic.AddInt64(&counter.Fail, 1)
            }
         }

         wg.Done()
      }(i)
   }

   wg.Wait()

   counter.Cost = (time.Now().UnixNano() - startTime) / 1000000

   log.Info("took %d ms for %d requests", counter.Cost, counter.Total)
   log.Info("sent     requests      : %d\n", counter.Total)
   log.Info("received requests      : %d\n", atomic.LoadInt64(&counter.Succ)+atomic.LoadInt64(&counter.Fail))
   log.Info("received requests succ : %d\n", atomic.LoadInt64(&counter.Succ))
   log.Info("received requests fail : %d\n", atomic.LoadInt64(&counter.Fail))
   log.Info("throughput  (TPS)      : %d\n", totalReqs*1000/counter.Cost)

}
这段代码的核心是用到了 sync.WaitGroup ,用来实现当所有的协程都执行成功后才统计我们的成功率、失败率、框架的 TPS 能力数据。并且使用原子包 atomic 进行计数。
我们来解释下核心的这段代码,并发数 concurrency 默认是 500,总请求数 total 默认是 1000000,支持用户传参修改。当 concurrency = 500 ,total = 1000000 时,用 for 循环启动了 500 个协程,每个协程需要发送 1000000/500 = 2000 个请求,这里使用了第二个 for 循环来循环发送请求,判断响应是否成功,如下:
   var wg sync.WaitGroup
   wg.Add(int(concurrency))

   startTime := time.Now().UnixNano()

   for i := int64(0); i < counter.Concurrency; i++ {

      go func(i int64) {
         for j := int64(0); j < perClientReqs; j++ {

            rsp := &testdata.HelloReply{}
            err := c.Call(context.Background(), "/helloworld.Greeter/SayHello", req, rsp, opts...)

            if err == nil && rsp.Msg == "world" {
               atomic.AddInt64(&counter.Succ, 1)
            } else {
               log.Info("rsp fail : %v", err)
               atomic.AddInt64(&counter.Fail, 1)
            }
         }

         wg.Done()
      }(i)
   }

   wg.Wait()
二、性能测试
测试工具写好之后,我们就对一个 gorpc 的 server 进行性能压测了。步骤如下:
## 先 clone 测试代码
git clone https://github.com/lubanproj/gorpc-benchmark.git
cd gorpc-benchmark
## 启动 server
go run -v server.go
## 另起终端,启动 client
go run -v client.go -concurrency=500 -total=1000000
按照上述步骤执行命令,得到下面结果:
took 13267 ms for 1000000 requests
sent     requests      : 1000000
received requests      : 1000000
received requests succ : 1000000
received requests fail : 0
throughput  (TPS)      : 75374
三、性能分析
1、pprof
go 语言自身提供了一套工具链来进行性能分析,这里主要用到的是一个大杀器 —— pprof 工具。
pprof 是 go 语言自带的工具包,可以用来进行性能分析,同时自带可视化。平常比较常用的性能分析包主要有下面两种:
- runtime/pprof:对程序 runtime 运行时的数据进行性能分析,包括 cpu、内存占用等
- net/http/pprof:采集 HTTP Server 的运行时数据进行分析,这个其实在上面的功能的基础上,包了一层接口,提供了一个 http 服务。
我们这里主要用 http 服务的方式,也就是第二个包。
使用姿势如下:
import (
   "net/http"
   _ "net/http/pprof"
)

func pprof() {
   go func() {
      http.ListenAndServe("localhost:8899", http.DefaultServeMux)
   }()
}
首先我们需要引入 “net/http/pprof” 这个包,然后调用 http.ListenAndServe(“localhost:8899”, http.DefaultServeMux) ,暴露出一个 http 服务,给用户查询性能分析的可见化结果,包括火焰图等。
2、分析调用链路
引入 pprof 工具后,在之前的步骤的基础上,稍微更改一下,启动 server 的时候同时启动 pprof,如下:
## 先 clone 测试代码
git clone https://github.com/lubanproj/gorpc-benchmark.git
cd gorpc-benchmark
## 启动 server
go run -v server.go pprof.go
## 另起终端,启动 client
go run -v client.go -concurrency=500 -total=1000000
启动 client 后,另起终端,执行:
go tool pprof http://localhost:8899/debug/pprof/profile?seconds=30
这个命令会采集 server 30s 内的 cpu 消耗情况,然后把结果输出到一个 profile 文件中,如下:
Fetching profile over HTTP from http://localhost:8899/debug/pprof/profile?seconds=30
Saved profile in /data/home/diubrother/pprof/pprof.server.samples.cpu.001.pb.gz
File: server
Type: cpu
Time: May 10, 2020 at 6:17pm (CST)
Duration: 30s, Total samples = 20.74s (69.13%)
Entering interactive mode (type "help" for commands, "o" for options)
分析 profile 文件,执行:
go tool pprof -http=:9000 /data/home/diubrother/pprof/pprof.server.samples.cpu.001.pb.gz
在浏览器中输入 http://localhost:9000/ ,即可看到服务的调用树,如下:
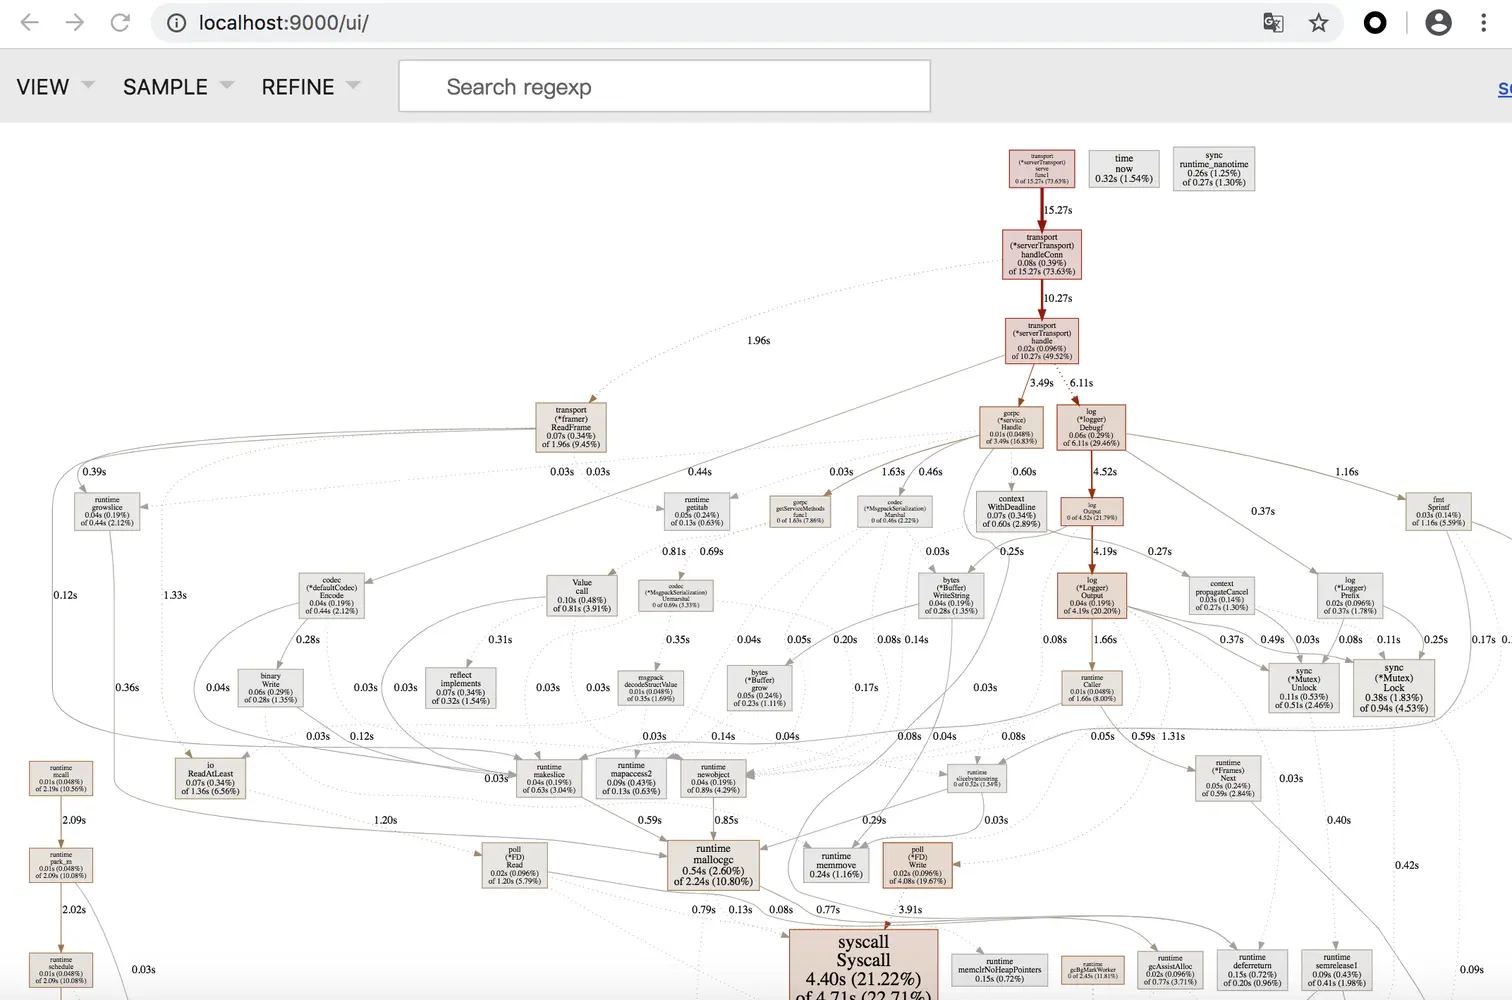
通过分析调用树,可以清晰看到系统的耗时和瓶颈。
小结
本章主要介绍了框架性能分析的流程,并且介绍了如何使用 pprof 进行性能分析。